
What are graphs in Data Structure?
- The power of graphs in DSA lies in their ability to represent relationships between objects, unlike linear data structures.
- It consists of a set of vertices (nodes) and a set of edges that connect pairs of vertices.
- These edges can be directed (representing a one-way relationship) or undirected (representing a two-way relationship) and can have weights to represent costs or distances.
- The ability of graphs to model real-world scenarios, such as social networks, transportation systems, and computer networks, makes them invaluable in various fields.
A graph (G) is defined as an ordered set of (v, e), where v(G) represents the set of vertices in a graph and e(G) represents the set of edges in a graph.
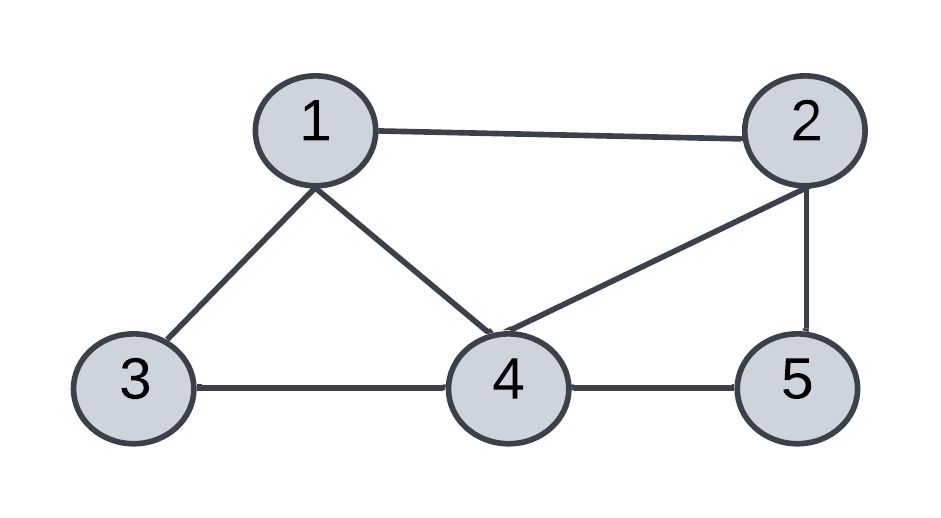
Table of Contents
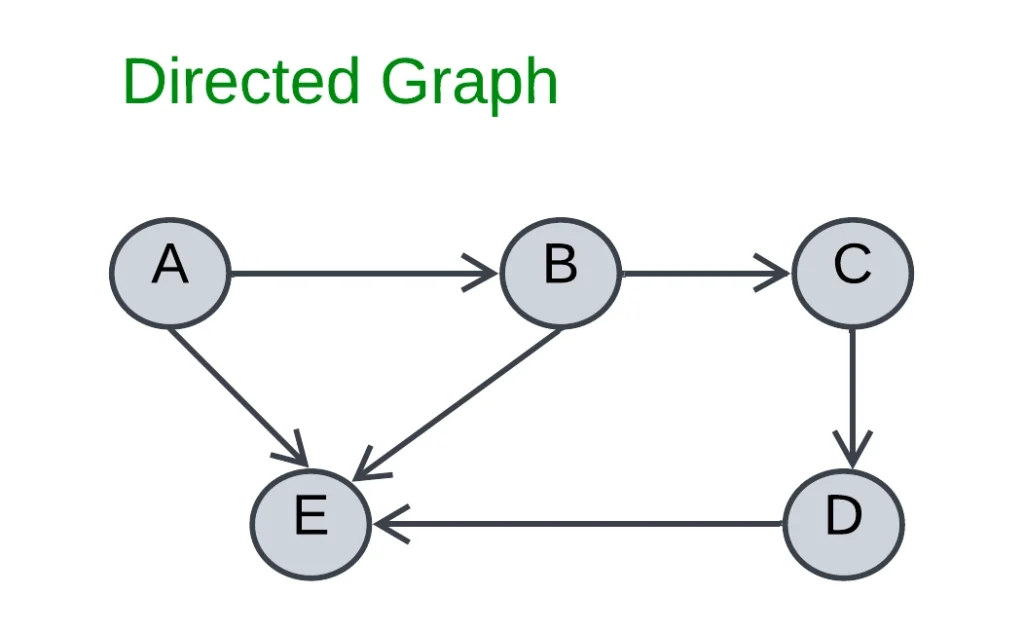
Directed Graph:
Directed Graph is also known as Di-Graph. A Di-Graph is a graph in which every edge is directly assigned to it. An edge of the directed graph is given as an ordered pair (u, v).
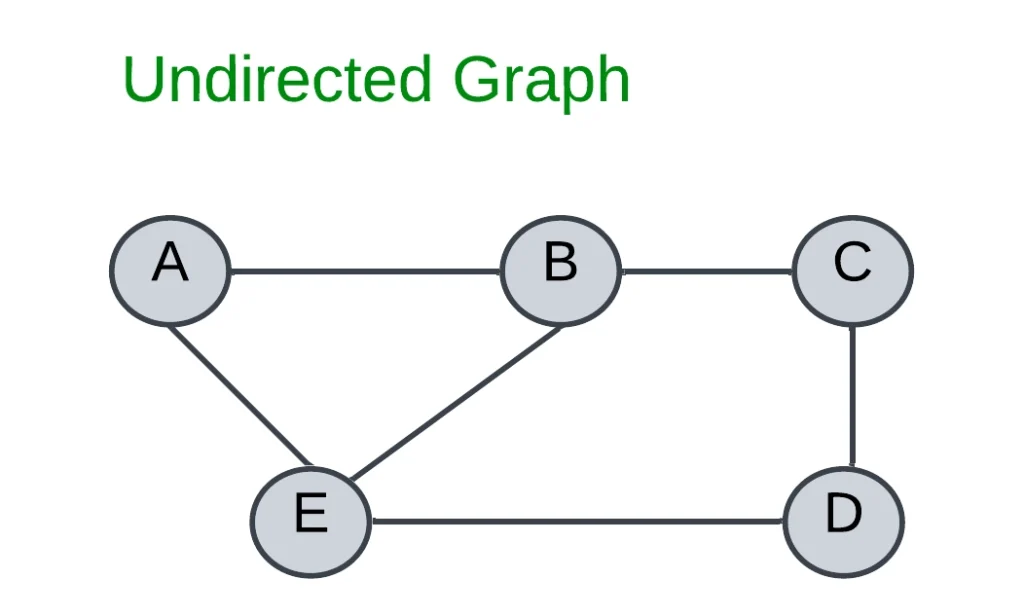
Undirected Graph:
In an Undirected graph, edges do not have any direction associated with them.
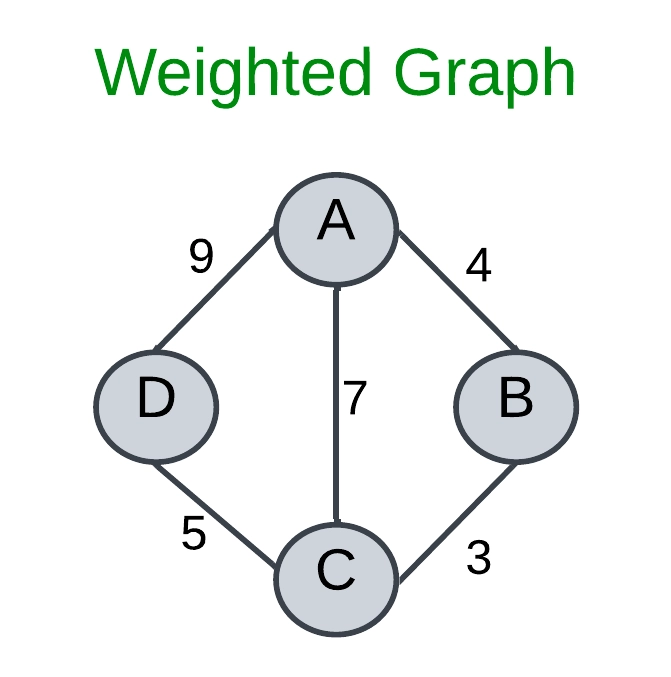
Weighted Graph:
Assigning weights to all edges in a graph or digraph creates a weighted graph, allowing us to model real-world scenarios where relationships have associated costs, distances, or strengths.
Path: A path P written as P=V1, V2, …..Vn of length n from a node due to V is defined as a sequence of n+1 nodes.
Cyclic Path: The path in which the first and the last vertices are the same.
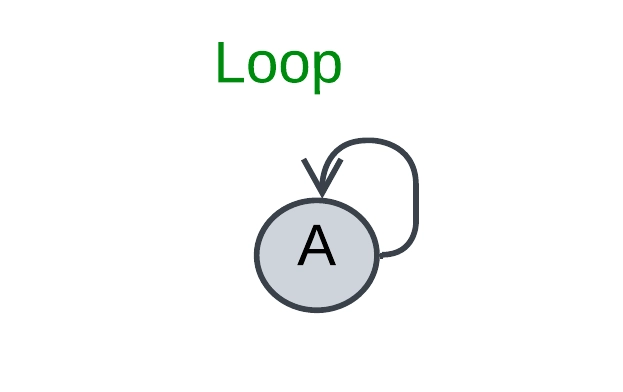
Loop: An edge that has identical endpoints is called a loop.
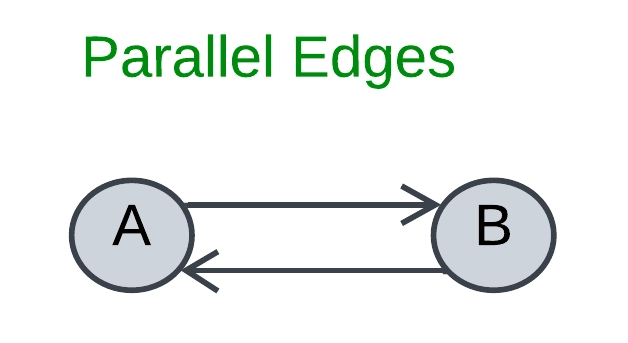
Parallel edges: In a graph, when two vertices are connected by more than one edge, these edges are referred to as parallel edges, representing multiple relationships between the same entities.
Adjacent Vertex: A vertex Vi is adjacent to Vj if there is an edge between Vi and Vj.
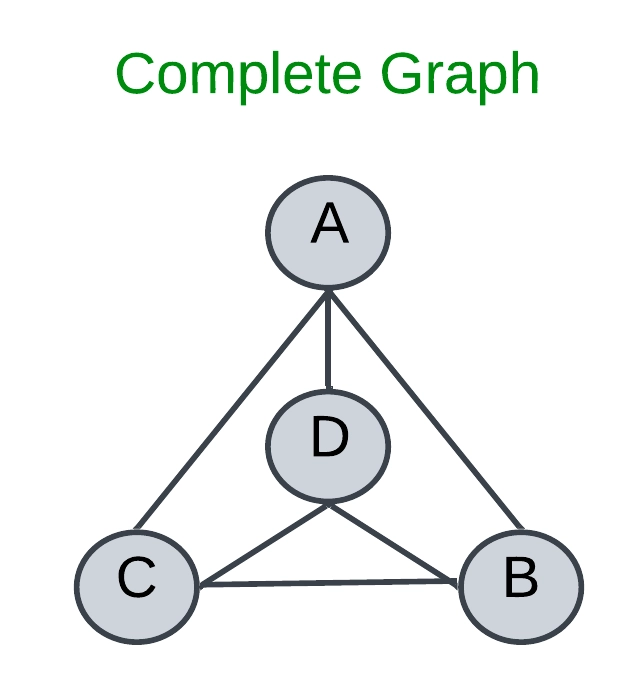
Complete Graph:
A complete graph is one where every vertex is directly connected to every other vertex.
Connected Graph:
A graph is said to be connected if for any two vertices u, v there is a path from u to v.
Degree of the Vertex:
The number of edges connected with vertex Vi is called the Degree of the vertex.
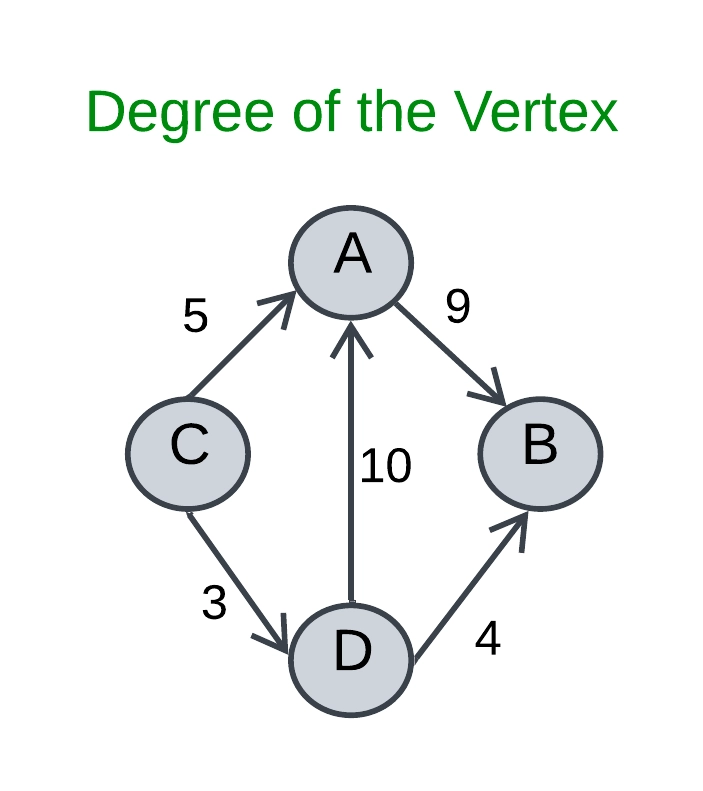
In-degree of the Vertex: The number of edges which are incident (incoming) to a vertex Vi
Out-degree of the Vertex: The number of edges emanating (going out) from a vertex Vi.
Pendent Vertex: A vertex Vi is pendent if its in-degree is one and out-degree is zero.
Acyclic Graph: A path containing one or more edges that starts and ends at the same vertex (Vi) is called a cycle.
Representation of Graphs:
A graph can be represented in many ways. Some representations are set representation, adjacency matrix, and adjacency list representation.
- Set Representation: Representing the graph using this method is very straightforward. In this method, two sets are maintained. One set is used for vertices and the second for edges.
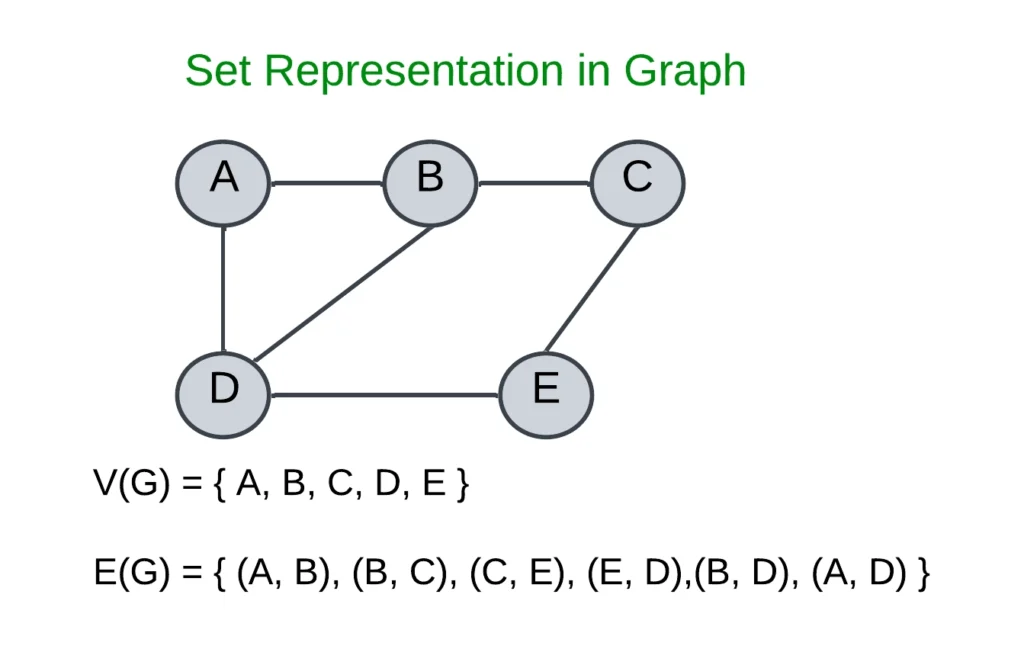
V(G)={A, B, C, D, E}
E(G)={(A, B), (B, C), (A, D), (B, D), (C, E), (D, E)}.
- Adjacency Matrix Representation: This representation highlights the adjacency relationships between vertices, showing which vertices have direct connections through edges.
- In an adjacency matrix, rows and columns are labeled by the graph vertices, and entry aij=1, if it is an adjacent vertex.
- Otherwise aij=0.
Ex:
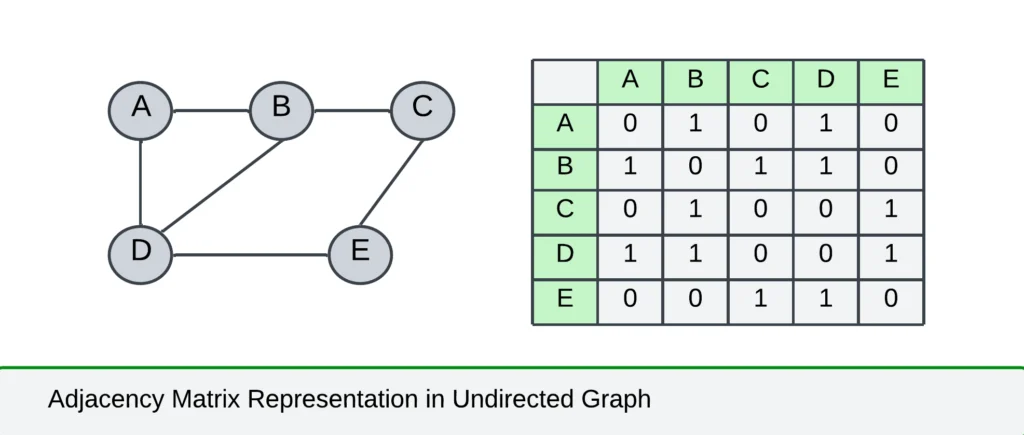
| A | B | C | D | E | |
| A | 0 | 1 | 0 | 1 | 0 |
| B | 1 | 0 | 1 | 1 | 0 |
| C | 0 | 1 | 0 | 0 | 1 |
| D | 1 | 1 | 0 | 0 | 1 |
| E | 0 | 0 | 1 | 1 | 0 |
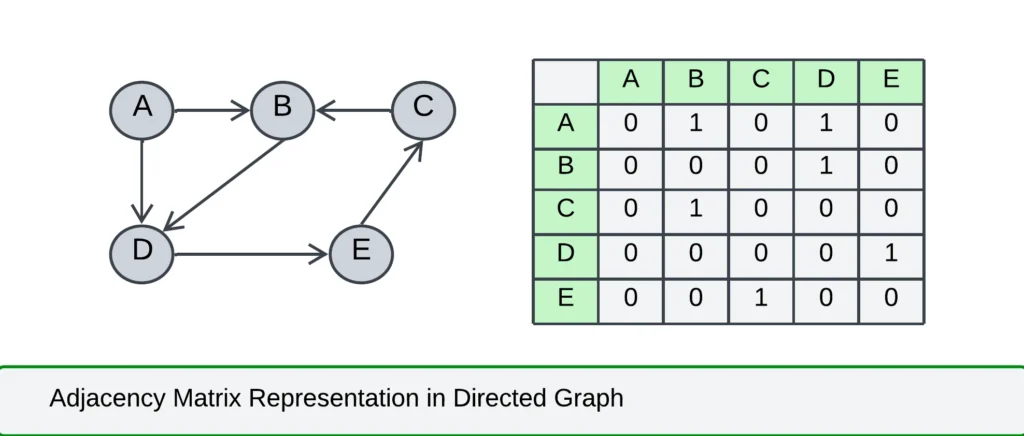
| A | B | C | D | E | |
| A | 0 | 1 | 0 | 1 | 0 |
| B | 0 | 0 | 0 | 1 | 0 |
| C | 0 | 1 | 0 | 0 | 0 |
| D | 0 | 0 | 0 | 0 | 1 |
| E | 0 | 0 | 1 | 0 | 0 |
- Adjacency List Representation: (Linked List Representation)
- It is another way to represent the graph in the computer’s memory. The structure consists of a list of all nodes in graph G.
- The adjacency relationships in graph G are represented through linked lists, where each node has a linked list storing the names of its neighboring nodes.
Advantages:
- It is easy to follow and clearly shows the adjacent nodes of the particular node.
- This is one of the most widely used methods for storing and representing graphs in computer science.
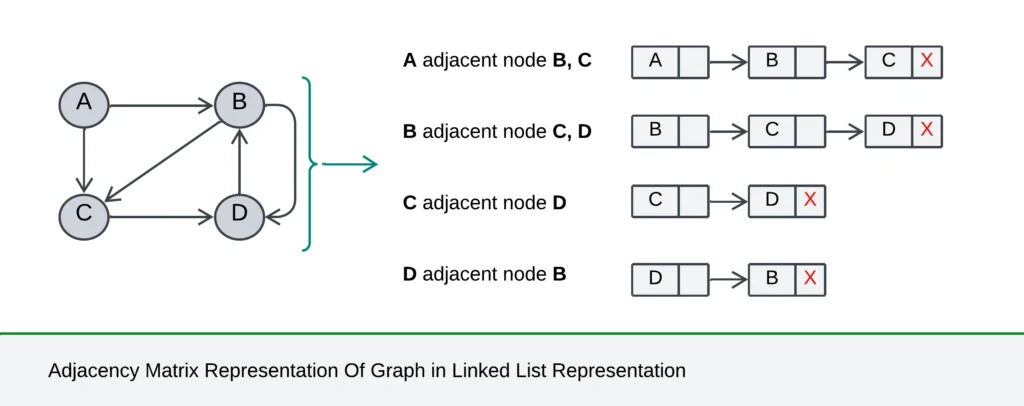
- A adjacent node B, C.
- B adjacent node C, D.
- C adjacent node D.
- D adjacent node B.
Advantages of graphs:
- Real-World Modeling: Graphs represent real-world relationships between entities, such as social connections or transportation routes.
- Flexibility: Graphs accommodate various relationship types and dynamic changes, making them adaptable to evolving systems.
- Efficient Pathfinding: Graphs with the help of algorithms like Dijkstra’s and BFS, enable highly efficient pathfinding and traversal essential for applications like navigation and network routing.
- Complex Problem Solving: From resource allocation to social network analysis, graphs offer a versatile framework for modeling and solving intricate problems based on relationships.
- Data Visualization: Graphical representations offer intuitive insights into complex relationships and patterns within data, aiding in understanding and analysis.
Disadvantages of graphs:
- Space Complexity: Graphs can be memory-intensive, especially for representing dense relationships, as they require storage for nodes and edges.
- Implementation Complexity: Implementing graph algorithms can be complex and require careful consideration of data structures and traversal methods.
- Inefficiency for Simple Relationships: For representing simple relationships, graphs might be overkill, and simpler data structures like arrays or linked lists could suffice.
- Algorithm Efficiency Varies: The performance of graph algorithms can vary significantly depending on factors like graph size, density, and implementation.
- Difficult to Visualize Large Graphs: While useful for visualization, large, complex graphs can become visually cluttered and difficult to interpret.
Related FAQs:
1. What are the different types of graphs?
Graphs can be classified based on various criteria:
- Directed vs. Undirected: Edges can be directed, indicating a one-way relationship (like a one-way street), or undirected, indicating a two-way relationship (like a friendship).
- Weighted vs. Unweighted: Edges can have weights assigned to them, representing costs, distances, or strengths of relationships, or they can be unweighted.
- Cyclic vs. Acyclic: Cyclic graphs contain at least one cycle (a path that starts and ends at the same vertex), while acyclic graphs have no cycles.
- Connected vs. Disconnected: In a connected graph, there is a path between any two vertices, while in a disconnected graph, there are vertices without a path between them.
2. What are some common graph algorithms?
Many algorithms have been developed to solve problems related to graphs. Some of the most common include:
- Breadth-First Search (BFS): Explores a graph level by level, finding the shortest path in unweighted graphs.
- Depth-First Search (DFS): This algorithm systematically explores the graph and prioritizes visiting a node’s unvisited child before revisiting previously explored nodes.
- Dijkstra’s Algorithm: Finds the shortest path between two nodes in a weighted graph with non-negative edge weights.
- Bellman-Ford Algorithm: Finds the shortest path in a weighted graph that may have negative edge weights (but not negative cycles).
- Prim’s and Kruskal’s Algorithms: These algorithms determine the Minimum Spanning Tree (MST) of a graph, which is a tree that connects all vertices with the lowest possible total edge weight.
3. How are graphs used in real-world applications?
Graphs have numerous real-world applications due to their ability to model relationships:
- Social Networks: Representing users and their connections (friendships, followers).
- Transportation Networks: Modeling cities as vertices and roads as edges to find the shortest routes.
- Recommendation Systems: Connecting users to products or content based on similarities and preferences.
- Network Routing: Determining optimal paths for data packets to travel across the internet.
- Dependency Graphs (Software Development): Visualizing and managing dependencies between different modules or tasks in a project.
4. How do I choose the right graph representation?
Choosing the appropriate graph representation depends on the specific problem and the operations you’ll be performing:
- Adjacency Matrix: Suitable for dense graphs (many edges) and provides constant-time edge lookups but can be memory-intensive for large graphs.
- Adjacency List: Generally more efficient for sparse graphs (fewer edges) and dynamic graphs (frequent updates) as it stores only existing edges.
- Edge List: Listing all edges provides a basic graph representation useful for specific algorithms. However, it can lead to increased processing time for operations like finding neighbors of a vertex.
- Implicit Graph: The graph is not explicitly stored but defined by a function or rule, often used in algorithms like BFS and DFS.
5. What are some applications of graph traversal algorithms?
Graph traversal algorithms, like BFS and DFS, are fundamental for exploring and analyzing graphs. These algorithms are used in a wide range of applications, including:
- Finding connected components in a graph: Identifying groups of vertices that are reachable from each other.
- Checking for cycles in a graph: Determining if a graph contains a path that starts and ends at the same vertex.
- Finding the shortest path in an unweighted graph (BFS): Useful for routing in networks or finding the shortest path in a maze.
- Topological sorting (DFS): Ordering vertices in a directed acyclic graph such that for every directed edge (u, v), vertex u comes before vertex v in the ordering.