
Transfer Function is of two types:
1. Block Diagram Representation
2. Signal Flowgraph
Table of Contents
Block Diagram Representation:
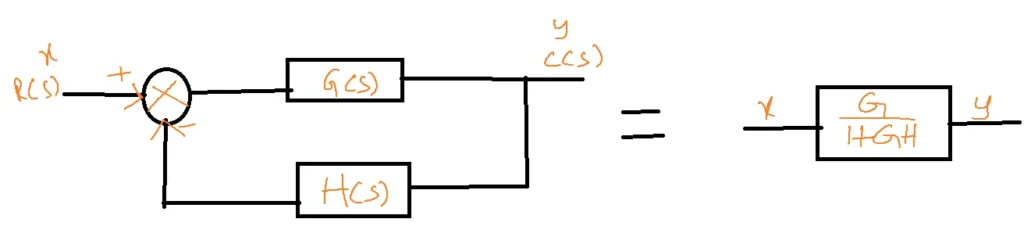
Consider a closed-loop
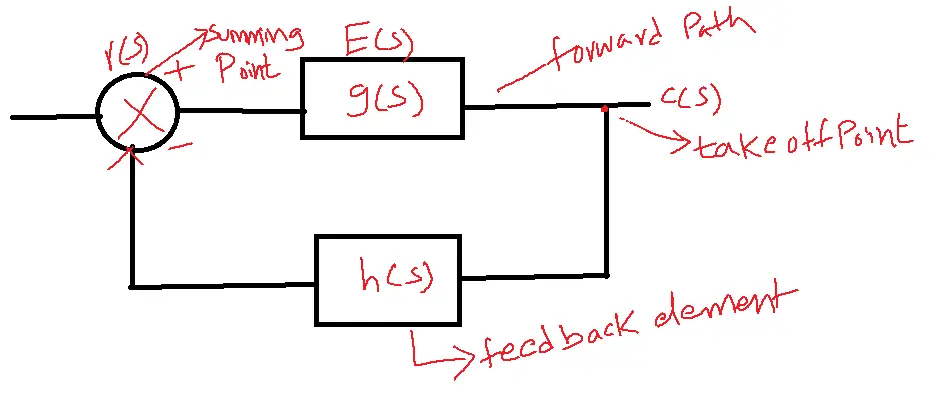
Here transfer function is G(s)/1+G(s)H(s) in this method the system is represented with the combination of different blocks indicating forward and feedback path gains.
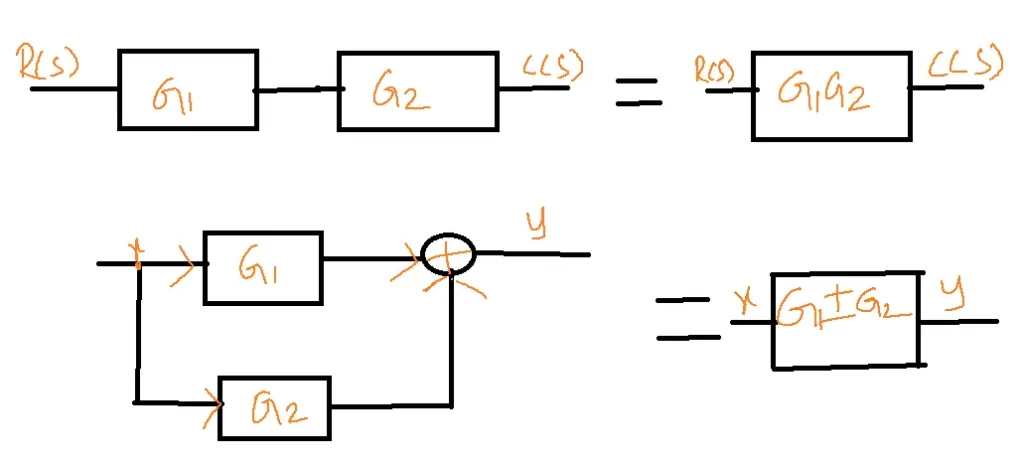
Parallel blocks:
Eliminating loop:
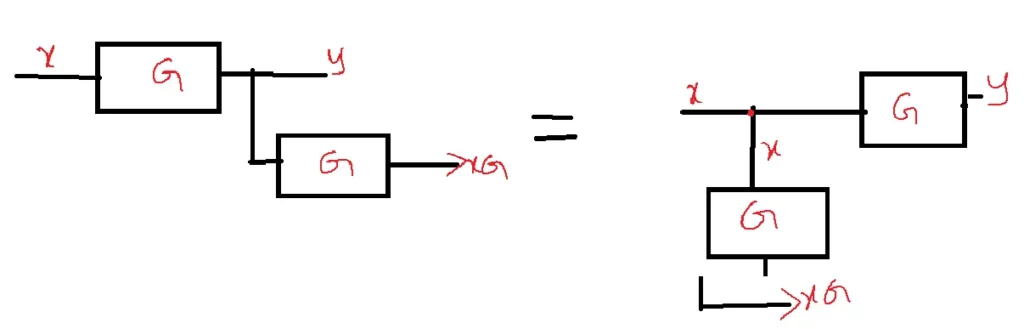
Shifting take-off point after the block:
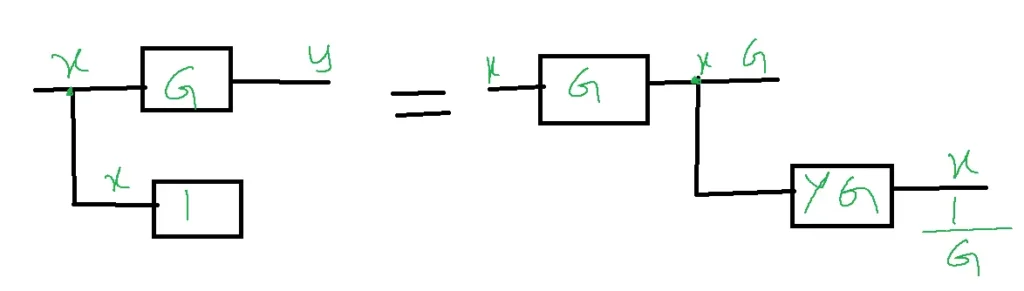
Shifting take-off point before the block:
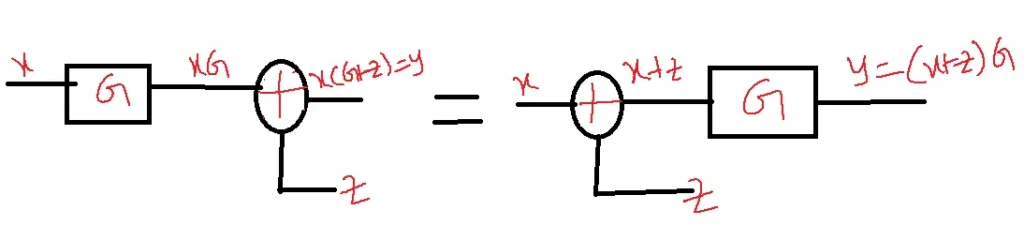
Shifting summing point after the block:
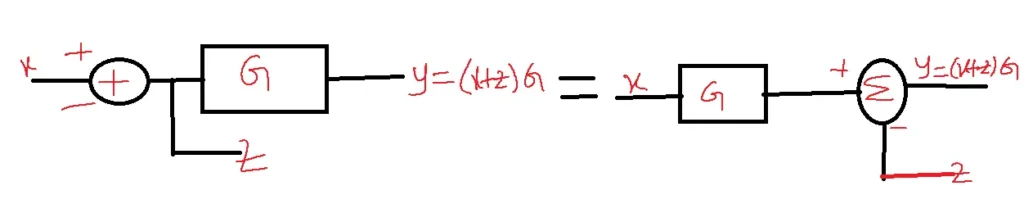
Shifting summing point before the block:
Multiple inputs and Multiple outputs of a system:
Consider a system having inputs R1 and R2 control outputs c1 and c2.
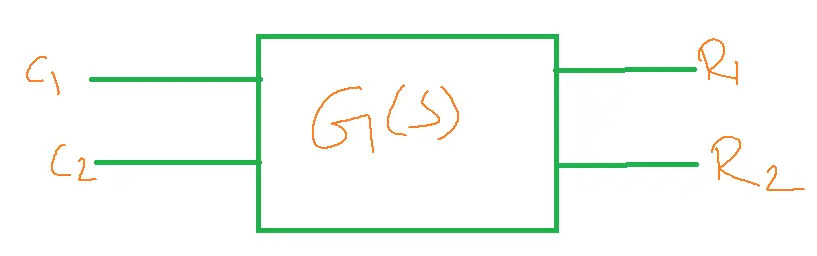
The transfer function of a multiple-input system
c1/R1 |R2=0
c2/R1 |R2=0
c1/R2 |R1=0
c2/R2 |R1=0
Signal Flow graph:
Signal flow graphs are used to determine the transfer function of a system.
In a signal flow graph, all the variables are represented as nodes.
The path from the input node to the output node is called forward path (No node should be repeated twice).
Forward Path Gain:
The product of all branch gains is known as Forward path gain.
The line joining between two nodes is known as a branch.
In the signal flow graph, the first node represents the input node, last node represents the output node.
Loop: A path that starts and terminates at the same node is known as a loop.
Loop Gain: The product of branch gains in a loop is called loop gain.
To determine the transfer function using a signal flow graph
Massan’s Gain formula is used
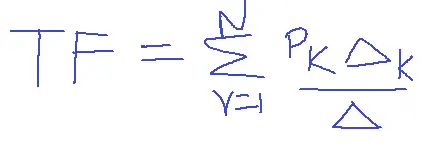
Where N= number of forward paths
PK=Gain of K’th forward path
DeltaK= The value of without K ‘th forward path.
Delta= 1-(sum of individual loop gains)+(sum of gain products of all possible combinations of two non-touching loops)-a sum of gain products of all possible combinations of three non-touching loops+…
Problem related to Signal flow graph:
1. Determine the transfer function using a signal flow graph.
Conversion from Block Diagram to Signal flow graph:
1. Represent each summing and take-off point by a separate node.
2. Connect them by the branches instead of blocks indicating the block transfer function as the gain of the corresponding branches.
3. Show the input and output nodes separately to complete the signal flow graph.
Problem: Convert the given block diagram into a signal flow graph and determine the transfer function.
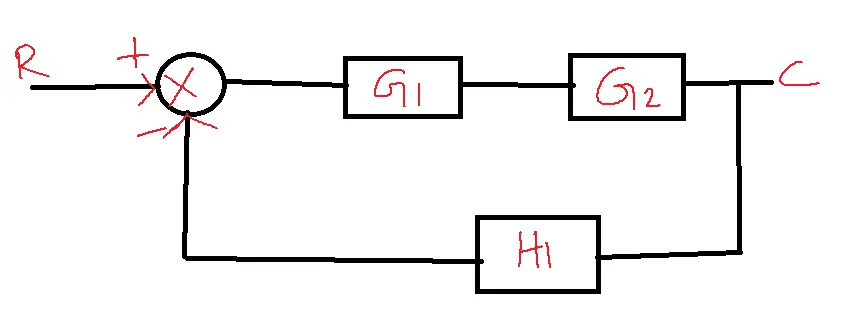
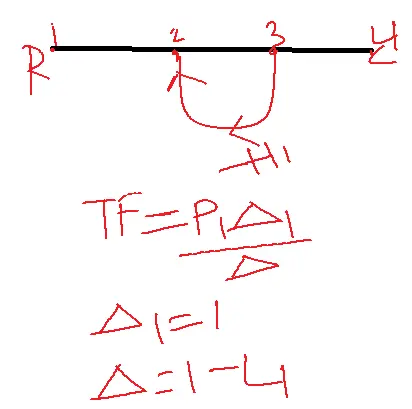
Solution:
C/R=G1G2/1+G1G2H1
P1=G1G2
L1=G1G2H1
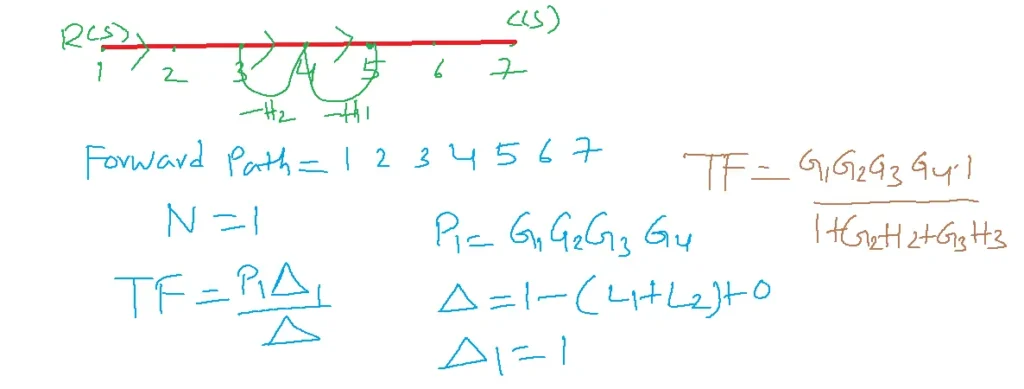
Problem: Convert the given block diagram into a signal flow graph and determine the transfer function.
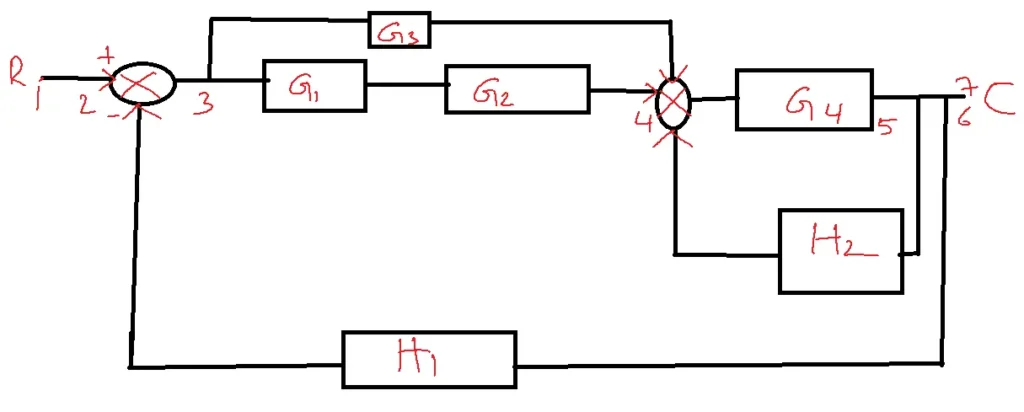
Solution:
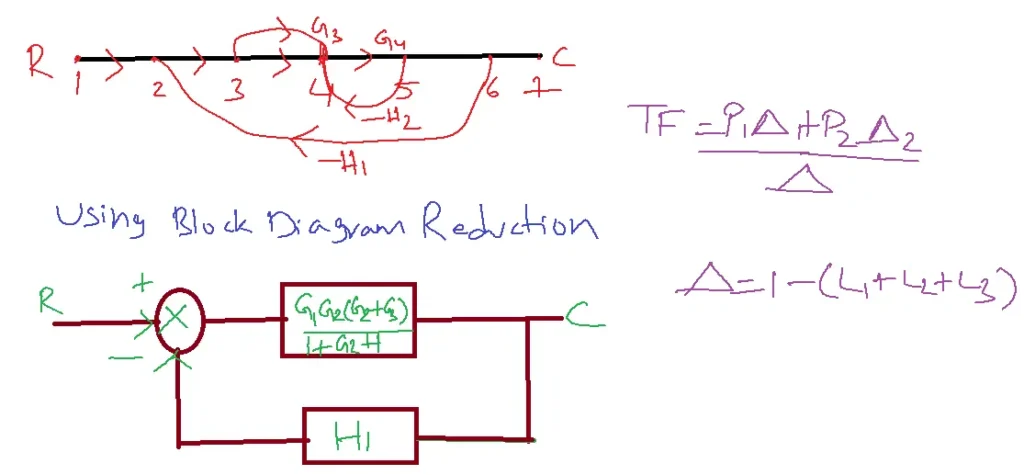
N=2
P1=G1G2G4
P2=G1G3G4
L1=-G4H2
L2=-G1G2G4H1
L3=-G1G2G3H1
Delta=1-(L1+L2+L3)
Determine the transfer function of a given electrical network
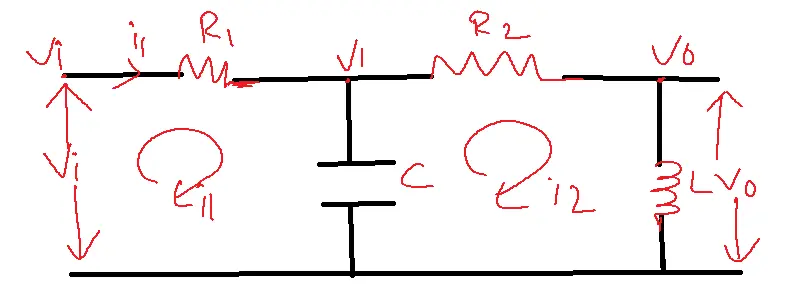
Solution:
i1= Vi-V1/R1=Vi/R1-V1/R1–1
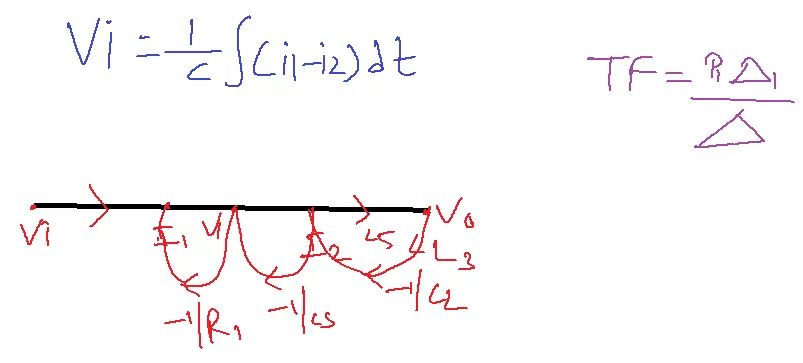
Vi=1/Cs(i1-i2)=i1/Cs-i2/Cs–2
i2=V1-V0/R2=V1/R2-V0/R2–3
V0=Ldi2/dt=Lsi2–4
N=1
L21=L1L3
delta=1-(L1+L2+L3)+L21
P1=Ls/R1R2Cs
delta=1
L1=-1/R1Cs L2=-1/R2Cs L3=-1/R2Cs
TF=[Ls/(R1R2Cs)]/1+(R1/R1C3)+1/R2C3+Ls/R2+Ls/R1R2C3.
FAQs related to the topic
Q1. What is a transfer function, and how is it related to a system’s input-output relationship?
- A transfer function is a mathematical representation of a system’s input-output relationship in the Laplace domain.
- It describes how a system responds to different input signals.
Q2. How do I find the transfer function of a system from its block diagram?
- Through the application of block diagram reduction techniques like series, parallel, and feedback combinations, a simplified diagram and the overall transfer function can be achieved.
Q3. How do I represent a transfer function in a signal flow graph?
- A signal flow graph visually depicts the relationships between system variables, with nodes representing variables and branches representing transfer functions.
Q4. How can I calculate the overall transfer function of a system from its signal flow graph?
- Mason’s gain formula provides a systematic method for calculating the overall transfer function by considering all possible paths and loops in the signal flow graph.
Q5. What is the difference between open-loop and closed-loop transfer functions?
- Open-loop transfer functions describe the system’s behavior without feedback, while closed-loop transfer functions incorporate feedback and characterize the overall system response.
Q6. How can I determine the stability of a system using its transfer function?
- By analyzing the poles of the transfer function (roots of the denominator), you can determine whether the system is stable, unstable, or marginally stable.
Q7. What is the significance of zeros in a transfer function?
- The presence of zeros affects the system’s transient behavior, potentially leading to an overshoot or undershoot in the output.
Q8. How can I use transfer functions to design controllers for a system?
- Transfer functions provide insights into a system’s dynamics, enabling you to design appropriate controllers (e.g., PID controllers) to achieve desired performance specifications.
Q9. What are the limitations of using transfer functions to analyze complex systems?
- Transfer functions are best suited for linear, time-invariant systems.
- Non-linear or time-varying systems may require alternative analysis techniques, such as state-space representation, for a more accurate representation of their behavior.
Q10. What software options can assist with the analysis and modification of transfer functions?
- MATLAB, Simulink, and other control system design software packages offer powerful tools for analyzing, simulating, and designing control systems based on transfer functions.