
A Bode plot in Control System is a graphical representation of a system’s frequency response, used to analyze and design control systems. It’s a powerful tool to visualize the behavior of a system’s gain and phase shift as frequency changes.
Components of a Bode Plot in Control System
1. Magnitude Plot: The system’s gain (amplitude) vs. frequency.
2. Phase Plot: Shows the system’s phase shift vs. frequency.
Key Features of a Bode Plot in Control System
1. Gain Crossover Frequency: Where the gain plot crosses 0 dB.
2. Phase Crossover Frequency: Where the phase plot crosses -180°.
3. Stability Margin: Distance between gain crossover and phase crossover.
4. Resonant Peak: Maximum gain value in the magnitude plot.
Table of Contents
How to Read a Bode Plot?
1. Gain: Measure the gain at a specific frequency.
2. Phase Shift: Determine the phase shift at a specific frequency.
3. Stability: Analyze the stability margin to ensure the system is stable.
- Consider a System with input r(t) and output c(t)
- c(t) is known as frequency response.
- The transfer function is c(s)/r(s)
- In the case of a unit impulse input, the system’s transfer function directly corresponds to its frequency response.
- The frequency response of a system can be obtained by varying the frequency and determining the magnitude and phase.
- A Bode plot is a graphical representation in the S domain.
Problems related to Bode Plot in Control System
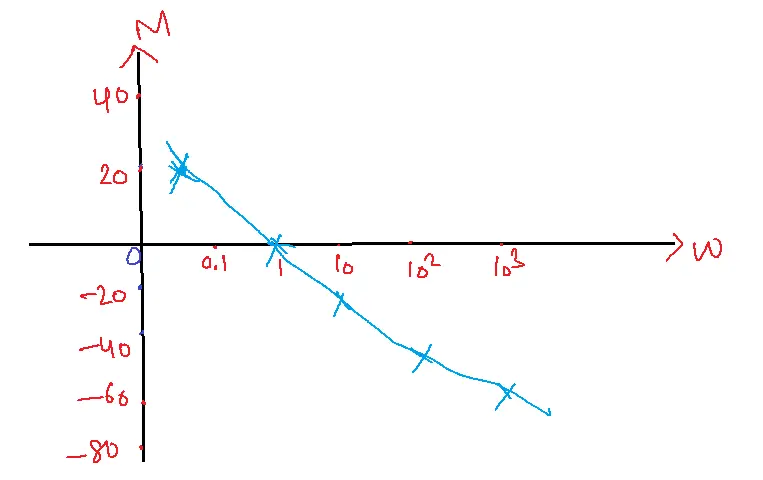
- Sketch the Bode plot for the transfer function 1/S.
Solution:
Substitute S=jw
TF=1/jw
Magnitude=1/w
Magnitude in dB= 20 log(1/w)
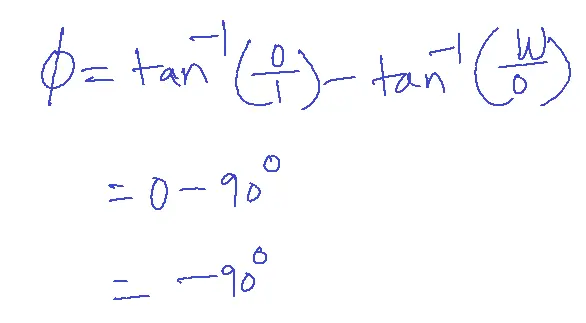
phase=phase of numerator – phase of denominator
w=0.1→ 20log101/0.1 = 20dB
w=1→20log101/1 = 0 dB
w=10→20log101/10 = -20 dB
w=100 → 20log101/100 = -40 dB
w=1000 →20log101/1000 = -60 dB
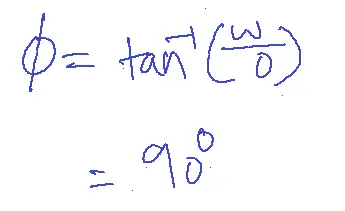
For all values of w phase=-90 degrees
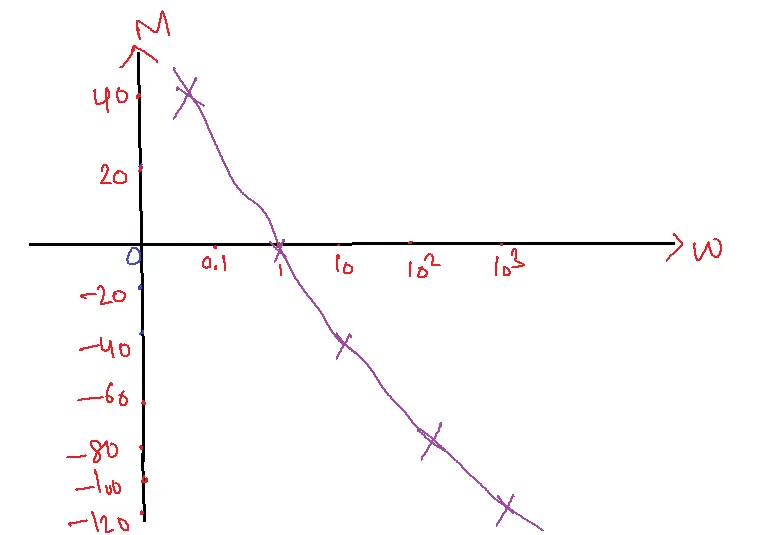
- Sketch the Bode plot for the transfer function 1/S2.
Solution:
Substitute S=jw
TF=1/(jw)2
Magnitude=1/w2
Magnitude in dB M= 20 log(1/w2)
W=0.1, 20log101/0.12 M=40 dB
| w=0.1 | M=40 dB |
| w=1 | M= 0 dB |
| w=10 | M= -40 dB |
| w=100 | M= -80 dB |
| w=1000 | M= -120 dB |
The gain is decreased by -40 dB per decade. Similarly, when the transfer function is 1/Sn, the magnitude starts at w=0.1, 20n dB.
At w=1, M=0 dB decreased by a factor of 20 N.
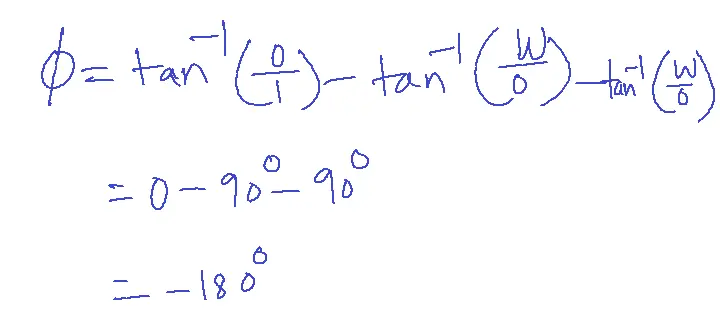
For all values of w phase=-N X 90 degrees
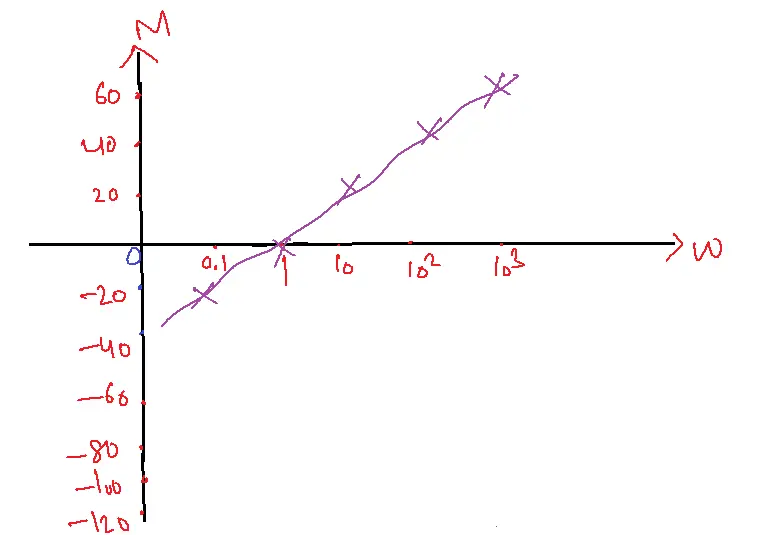
- Sketch the Bode plot for the transfer function S.
Solution:
Substitute S=jw
TF=jw
Magnitude=w
Magnitude in dB M= 20 log10(w)
| w=0.1 | M=-20 dB |
| w=1 | M= 0 dB |
| w=10 | M= 20 dB |
| w=100 | M= 40 dB |
| w=1000 | M= 60 dB |
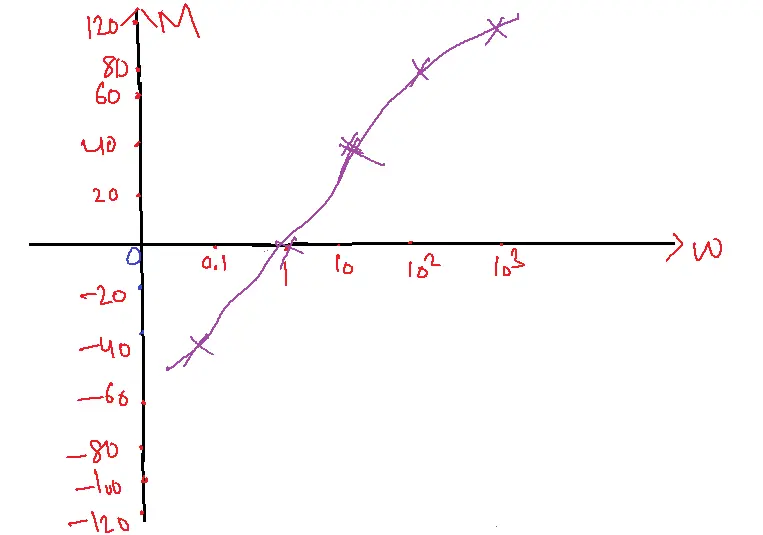
- Sketch the Bode plot for the transfer function S2.
Solution:
Substitute S=jw
TF=(jw)2
Magnitude=w2
Magnitude in dB M= 20 log10(w2)
| w=0.1 | M=-40 dB |
| w=1 | M= 0 dB |
| w=10 | M= 40 dB |
| w=100 | M= 80 dB |
| w=1000 | M= 120 dB |
When the transfer function is S2, the magnitude plot rises by 40 dB per decade.
Similarly when the transfer function is Sn, the magnitude plot rises by 20n per decade.
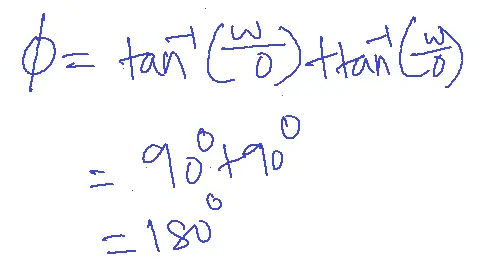
The phase is n X 90 degrees.
- Sketch the Bode plot for the transfer function K.
Solution:
Magnitude=K
Magnitude in dB M= 20 log10(K)
Image
| K=0.1 | M=-20 dB |
| K=1 | M= 0 dB |
| K=10 | M= 20 dB |
When K=1, the Bode plot is known as the reference plot.
When K>1, the Bode plot is shifted upward by 20 log(K).
When K<1, the Bode plot is shifted downward by 20 log(K).
Advantages of Bode Plot in Control System
1. Easy to Interpret: Bode plots visually depict a system’s frequency response, facilitating understanding and analysis.
2. Frequency Response Analysis: Bode plots help design and optimize control systems by analyzing the system’s behavior at different frequencies.
3. Stability Analysis: Bode plots enable stability analysis, ensuring the system is stable and robust.
4. Gain and Phase Margin: Bode plots provide gain and phase margin, essential for ensuring system stability.
5. Simple to Plot: Bode plots are relatively simple, even for complex systems.
6. Intuitive Design: Bode plots facilitate intuitive design and optimization of control systems.
Disadvantages of Bode Plot in Control System
1. Approximations: Bode plots are based on approximations, which can lead to inaccuracies.
2. Limited Accuracy: Bode plots excel at providing valuable insights into the frequency response of many systems, particularly those with simpler structures or well-defined resonant peaks.
3. Difficult to Plot: Bode plots can be challenging for systems with multiple poles and zeros.
4. Time-Consuming: Plotting Bode plots can be time-consuming, especially for complex systems.
5. Limited Information: Bode plots provide limited information about the system’s time-domain behavior.
6. Not Suitable for Non-Linear Systems: Bode plots are not suitable for non-linear systems, as they assume linearity.
Applications of Bode Plot in Control System
1. Stability Analysis: Bode plots help determine system stability by analyzing gain and phase margins.
2. Controller Design: Bode plots aid in designing controllers, such as PID controllers, to achieve desired system behavior.
3. Filter Design: Bode plots design filters, like low-pass, high-pass, and band-pass filters.
4. System Identification: Bode plots help identify system parameters, like transfer functions, from experimental data.
5. Frequency Response Analysis: Bode plots analyze system behavior at different frequencies, ensuring desired performance.
6. Robustness Analysis: Bode plots evaluate system robustness to parameter variations and disturbances.
7. Sensitivity Analysis: Bode plots analyze system sensitivity to changes in parameters or inputs.
8. Optimization: Bode plots facilitate optimization of control systems for performance, stability, and robustness.
9. Troubleshooting: Bode plots help troubleshoot control system issues, like oscillations or instability.
10. Education and Research: Bode plots are used in academic and research settings to teach control systems concepts and analyze complex systems.
Industry Applications
1. Process Control: Bode plots are used in chemical processing, oil refining, and power generation.
2. Aerospace Engineering: Bode plots are applied in aircraft and spacecraft control systems.
3. Automotive Systems: Bode plots are used in vehicle control systems, like cruise and traction control.
4. Robotics: Bode plots are applied in robotic control systems for stability and performance analysis.
5. Power Systems: Bode plots are used in power grid control and stability analysis.
Bode Plot in Control System FAQs
1. What is a Bode plot?
- A Bode plot is a graphical representation of a linear time-invariant system’s frequency response.
- It consists of two plots: one showing the magnitude (gain) in decibels (dB) and the other showing the phase shift in degrees, plotted against frequency on a logarithmic scale.
2. Why are Bode plots used in control systems?
- Bode plots are crucial in control system analysis and design because they provide valuable insights into:
- System stability: Determining if a system is stable or unstable based on gain and phase margins.
- Frequency response: Understanding how the system responds to different input frequencies.
- System performance: Evaluating bandwidth, gain, and phase characteristics to optimize the system’s behavior.
3. How to read a Bode plot?
- Magnitude plot: The vertical axis represents the gain in dB, and the horizontal axis represents frequency on a logarithmic scale. The plot shows how the system’s gain changes with frequency.
- Phase plot: The vertical axis represents the phase shift in degrees, and the horizontal axis represents frequency on a logarithmic scale. The plot shows how the system’s phase changes with frequency.
4. What are the gain and phase margins in a Bode plot?
- Gain margin: The additional gain the system can tolerate before becoming unstable. The difference between the gain at the phase crossover frequency (where the phase is -180 degrees) and 0 dB.
- Phase margin: The amount of additional phase lag the system can tolerate before becoming unstable. It’s the difference between the phase at the gain crossover frequency (where the gain is 0 dB) and -180 degrees.
5. How are Bode plots used to determine system stability?
- A stable system has positive gain and phase margins, as indicated by a Bode plot.
- A zero or negative margin indicates instability and potential oscillations.
- Bode plots help assess stability and facilitate design adjustments to ensure system stability.